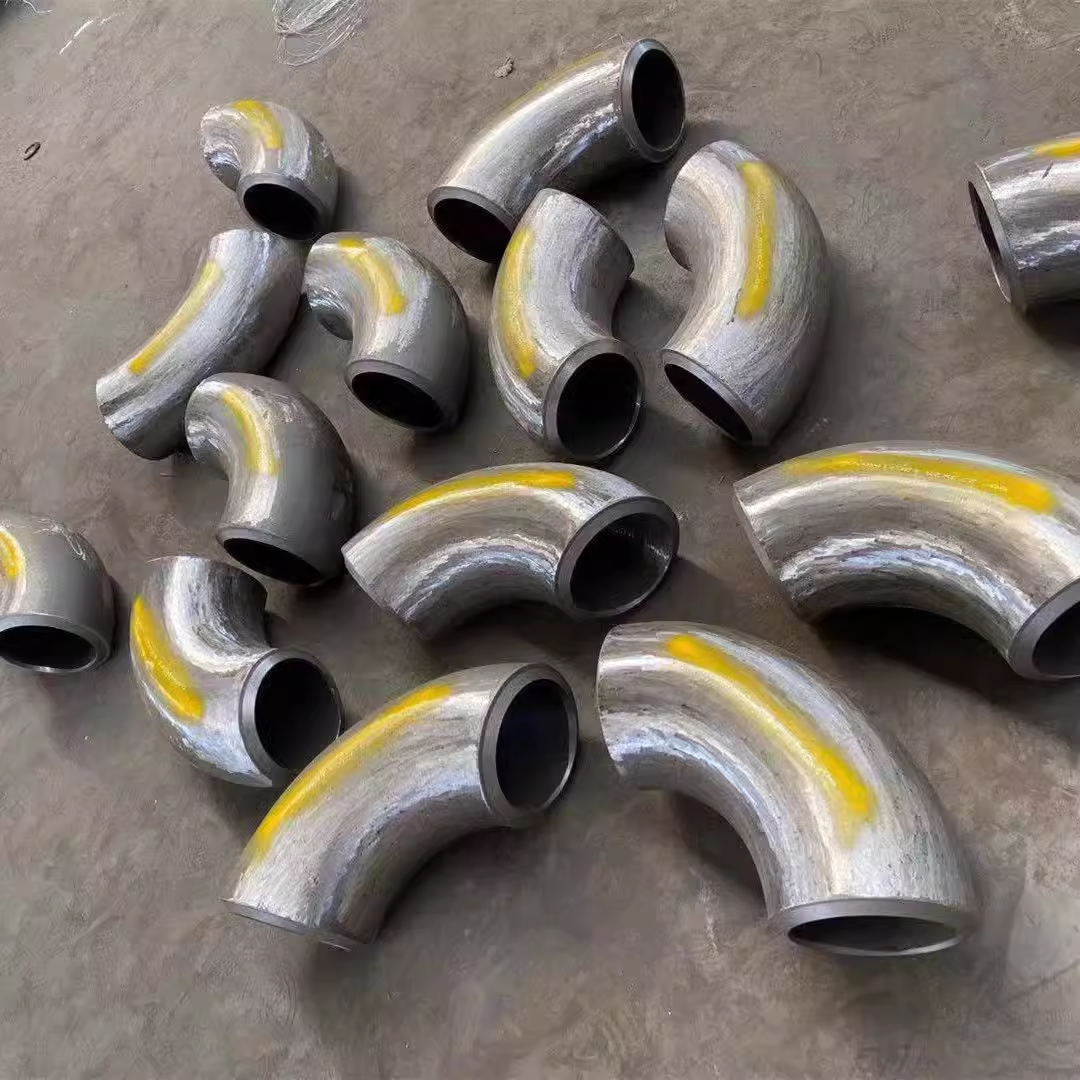
Numerical Simulation Analysis of Flow-Accelerated Corrosion inCarbon Steel Tee Tube in Power Plants
Abstract:
As common components in powerplant piping, ensuring the safe operation of tee tube is of great significance for the actual produc-tion of power plants. In this study, computational fluid dynamicssimulations and the Sanchez-Caldera model were employed to investigate theefects of different inlet fow velocities on the flow-accelerated corrosion rates of T-type tee diversiontubes and T-tpe tee confluence tubes,considering the actual operating conditions of power plants. The results indicated that, under the same inlet flow velocity, the flow-acceleratedcorosion wasmore severe in T-type tee diversion tubes. The maximum flow-accelerated corrosion rates ratein T-type tee diversiontubes oc-cured at the 0.5D positon from the branchoutlet, whileinT-typetee confluencetubes, the maximumflow-accelerated corrosion rates rate waslocated at the sidewall downstream of the main pipe intersection at the ID position. Additionaly, it was found thatthe inletflow velocity did notafect the senstive locations of flow-accelenated corrosion rates. Thefindings of this study provided sinificant guidancefor the design and oper-ation of power plant piping systems.
Introduction
With the continuous growth of energy demand, the efficiency and reliability of power generation equipment are crucial to meet global energy demand. In power plants, tee pipe fittings, as important pipeline connection components, have important functions related to safe operation. However, in actual operation, tee pipe fittings often fail due to flow-accelerated corrosion of the fluid, which not only affects the safe operation of the pipeline, but may also cause serious production accidents-3. Therefore, the study of flow-accelerated corrosion of tee pipe fittings has important practical significance.
Flow-accelerated corrosion (FAC) is one of the most common corrosion problems in power plant pipelines. According to the statistical data on the failure rate of equipment and pipeline components in French nuclear power plants, flow-accelerated corrosion is the most common type of damage, accounting for 58% of the total failures^([3]). Therefore, the study of flow-accelerated corrosion is of great significance to the actual operation and production of power plants. Domestic and foreign scholars have conducted a series of studies on the problem of tee pipe fittings failing due to flow-accelerated corrosion. Among them, Ting et al. conducted a statistical analysis of the on-site pipeline failures of the BWR-6 nuclear power plant and found that the main pipeline side of the combined tee was prone to failure, with an accident rate of up to 38%. Li Dejun et al. analyzed the failure of 20 steel equal-diameter tees through experimental research and found that the corrosion pits on the inner wall of the tee became the crack source of brittle fracture. Han Nannan et al. used FLUENT and electrochemical experiments to study the failure of tee pipe fittings and concluded that the synergistic effect of galvanic corrosion and mechanical scouring was the main cause of the failure of tee pipe fittings. Xiao Zhuonan et al. established the relationship between temperature and flow-accelerated corrosion of carbon steel pipelines based on the steady-state flow-accelerated corrosion prediction model and compared it with the experimental data in the literature. However, the research on flow-accelerated corrosion of T-type tee splitter pipe fittings and T-type tee confluence pipe fittings is still insufficient. At the same time, it is crucial to predict their distribution in combination with the flow-accelerated corrosion mechanism for the safe operation of actual power plants.
This work aims to use computational fluid dynamics simulation and the Sanchez-Caldera model to study the influence of different inlet flow velocities on the flow-accelerated corrosion rate distribution of T-type tee splitter pipe fittings and T-type tee confluence pipe fittings, and verify the accuracy of the model by comparing with the statistical results of literature experiments and actual failed pipelines in power plants. The research results can provide an important reference for the safe operation of actual power plants.
FAC model
According to the Sanchez-Caldera model8, the flow-accelerated corrosion of pipelines under reductive total volatile treatment can be divided into four processes, as shown in Figure 1:
① The iron on the surface of the metal matrix reacts with the reductive water to generate Fe^(2+), and the overall reaction equation is:Fe+2H2O→Fe(OH)2+H2↑ (1)
② Part of it undergoes hydration and converts into an oxide film, and the other part diffuses into the solution through the oxide film. The chemical reaction equation is:3Fe(OH)_2→Fe_3 O_4+H_2↑+2H_2 O
③The oxide film dissolution products diffuse into the main solution;
④The oxide film dissolution products diffuse into the main solution are carried away by the fluid.
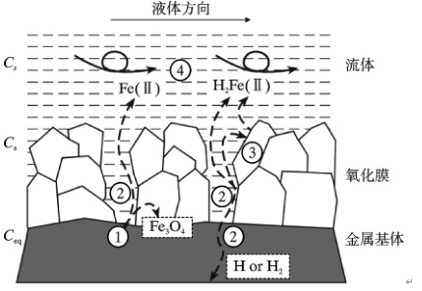
Fig. 1 FAC mechanism
Since the iron content in the main solution is very small and can be ignored, the FAC rate can be expressed as [8] under the reductive full volatilization treatment method:
(3)
Wherein, C_eq is the equilibrium concentration of soluble iron-containing components (mol/L); K^* is the chemical reaction rate constant (m/s); f is the proportion of conversion to oxide film, Berge et al. believed that f=0.5; δ is the oxide film thickness (m); 0 is the porosity; D is the diffusion coefficient of the iron-containing component (m^2/s); k is the mass transfer coefficient (m/s).
According to the research of Liu Zhong et al.10, when the temperature is below 100℃, the oxide film formed on the pipeline surface is thin and loose, about 5nm. Therefore, at this temperature, the mass transfer between the oxide films can be ignored. However, when the temperature is between 100 and 225℃, the thickness of the oxide film is about 1μm^[11], and the gaps gradually become more compact, so it is necessary to consider the mass transfer process of the iron-containing component between the oxide films. The mass transfer coefficient k can be expressed by the Chilton-Colburn ratio12:
a, b and c are empirical constants; Reynolds number Re and Schmidt number S_c are dimensionless numbers; d and l are the pipe diameter and equivalent diameter, m, respectively. Introducing shear stress 7, k can be expressed as [13]:
(5)
Where p is the fluid density, v is the average velocity, and is the fluid dynamic viscosity, Pa·s.
Where the wall shear stress 7 is [10]: (6)
(6)
Where dU is the velocity gradient near the wall, m/s; dy is the distance from the node to the surface, m
The chemical equation for oxide film dissolution under reductive full volatilization treatment is [3.91:
The chemical reaction equilibrium constant K_x of each process can be expressed as:

The chemical reaction equilibrium constant Kx of each process can be expressed as: Where x = 0, 1, 2, 3. K_x can be obtained from the experimental measurement results of Berge et al. Therefore, the equilibrium concentration of the iron-containing component solution C_eq:
In the formula, the concentration of H2 is![]()
The chemical reaction rate constant K, oxide film thickness 8 and porosity 0 can be obtained by looking up the table; the mass transfer coefficient k is first obtained by computational fluid dynamics simulation to obtain the wall shear stress, and then obtained according to formula (5); the iron-containing component dissolution equilibrium concentration C_eq is obtained by formula (9); finally, the FAC rate is calculated according to formula (3).
2 Model establishment
The geometric model of the equal-diameter tee pipe fitting is shown in Figure 2. The pipe diameter is 50mm. In order to ensure that the fluid can fully develop, the length of the horizontal pipe is 1000mm and the length of the vertical pipe is. The geometric model is structurally meshed using the 0-type segmentation in the ICEM software. The mesh is encrypted near the wall, and the height of the first layer of the near-wall mesh is 0.05mm. The simulation is performed using Ansys-fluent software to simulate the fluid dynamics characteristics of the T-type tee confluence pipe fitting and the T-type tee diversion pipe fitting. The Realizable k-model is used to solve the turbulence equation, and the Enhanced Wall Function is used to solve the wall function. The temperature is set to 150℃, the pressure is set to 2MPa, and the pH value is 9.0 at room temperature 25℃. The inlet flow rate uses the actual common flow rates of 1m/s, 2m/s, 4m/s and in the single-phase flow pipeline of the power plant. The inlet boundary condition uses the velocity inlet, and the outlet boundary condition is the pressure outlet. According to previous test results and field statistical data [4.15.16], the flow-accelerated corrosion sensitive positions of T-type tee diversion fittings and T-type tee confluence fittings are located on the side wall of the branch pipe auxiliary outlet and downstream of the main pipe fork. Therefore, this work only analyzes the flow-accelerated corrosion characteristics of the side wall of the branch pipe auxiliary outlet (A-A’) and the downstream of the main pipe fork (B-B’, C-C’ and D-D’) of the T-type tee under different conditions, and compares them with the literature test and field statistical results.
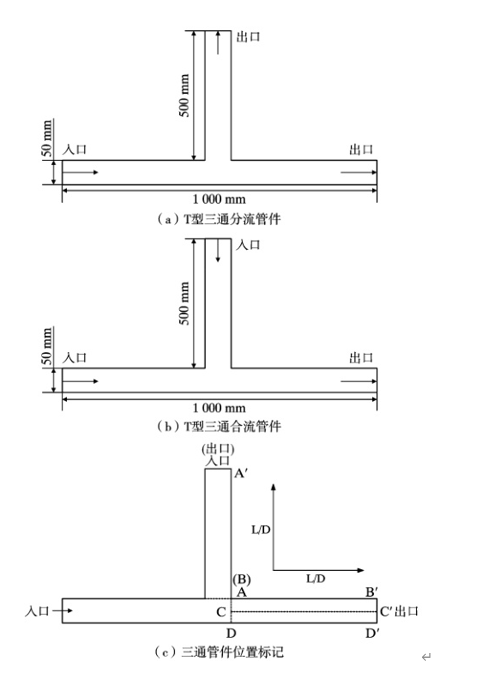
Fig. 2 Geometric model schematic diagram of T-shaped tee pipe
3 Results and Analysis
Figure 3 shows the cross-sectional flow field distribution cloud map of the T-type three-way split and merge fittings when the flow velocity is 1m/s. It can be seen from the figure that the velocity reaches the maximum value at the frontal surface of the auxiliary outlet of the T-type three-way split fitting, and a “vortex” phenomenon occurs near the back surface of the auxiliary outlet. For the T-type three-way merge fitting, the velocity is at the downstream of the main pipeline fork, and a “vortex” phenomenon appears above the maximum value. The reason for these phenomena is that when the fluid is splitting, it will impact the wall of the frontal surface and cause reflection. When merging, the fluid confluence from different inlets will impact the wall of the main pipeline downstream of the fork, thereby changing the direction of the fluid.
According to the cloud map of the shear stress of the wall of the T-type three-way split and merge fittings in Figure 4, it can be seen that the shear stress of the T-type three-way split fitting is the largest on the back surface of the auxiliary outlet. The T-type three-way merge fitting is located at the downstream of the main pipeline fork.

Fig. 3 Flow field distribution of T-shaped branching and merging pipe at an inlet velocity of 1 m/s
The maximum shear stress is shown on the downstream side wall. As can be seen from Table 1, with the increase of inlet flow rate, the maximum value of shear stress also shows an increasing trend.

Fig. 4 Wall shear distribution of T-shaped branching and merging pipe at an inlet velocity of 1 m/s
Table 1 Maximum shear stress T_max and maximum turbulent kinetic energy TEK of T-type three-way flow divider and T-type three-way confluence fittings
| v/(m·s1)Tmax(Separate )TEK(Separate )Tmax(Merge )TEK(Merge ) | ||||
| 14.18 | 0.020 | 24.17 | 0.517 | |
| 13.93 | 0.077 | 82.30 | 2.088 | |
| 47.02 | 0.278 | 283.14 | 8.446 | |
| 6 | 96.39 | 0.596 | 585.77 | 19.121 |
Table 1 The maximum shear stress and maximum turbulentenergy of T-shaped branching and merging pipe
Figure 5 is a turbulent kinetic energy distribution cloud diagram of the cross-section of the diverting and converging tee pipes at an inlet flow rate of 1m/s. According to Figure 5, similar to the velocity flow field cloud diagram, the maximum turbulent kinetic energy appears downstream of the auxiliary outlet of the T-type tee diverting pipe fitting. The maximum turbulent kinetic energy is shown downstream of the main pipeline fork of the T-type tee converging pipe fitting. This is because the fluid forms a vortex downstream of the auxiliary outlet of the diverting pipe fitting and downstream of the main pipeline fork of the converging pipe fitting, causing the nearby turbulence to be in an unstable state, thereby generating the maximum turbulent kinetic energy. In addition, it can be seen from Table 1 that with the increase of the inlet flow rate, the instability of the turbulence increases, so that the maximum turbulent kinetic energy increases with the increase of the inlet flow rate.
Figure 6 shows the mass transfer coefficient of different pipelines of the T-type tee diverting pipe fitting. As shown in Figure 6, the inlet flow rate is a constant, and the mass transfer coefficient presents a maximum value at A-A’ of the T-type tee diverting pipe fitting, corresponding to the 0.5D frontal surface position of the auxiliary outlet of the diverting pipe fitting branch.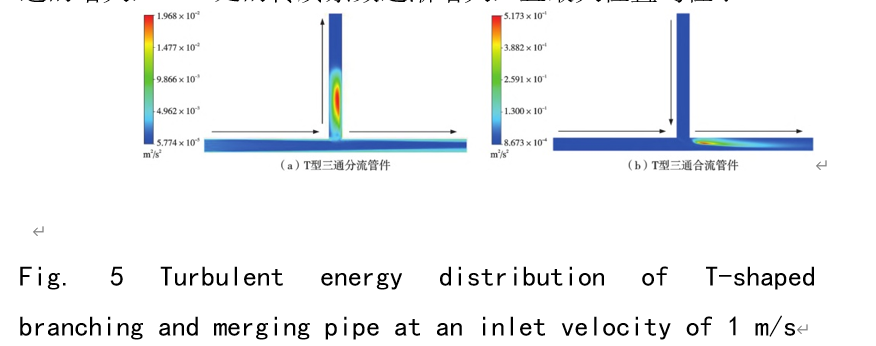
The mass transfer coefficient at other positions has no significant change compared to the auxiliary outlet. In addition, with the increase of inlet flow rate, the mass transfer coefficient at A-A’ gradually increases, and the maximum position is located at the 0.5D flow surface of the branch pipe auxiliary outlet; after the 5D position, the fluid is fully mixed and the mass transfer coefficient remains basically unchanged. According to formula (3), the mass transfer coefficient is mainly related to the shear stress of the pipe wall, and the shear stress is maximum near the flow surface of the branch pipe auxiliary outlet of the diversion pipe fitting, so the mass transfer coefficient also presents a maximum value at this position, which is consistent with the analysis results of Figure 4.
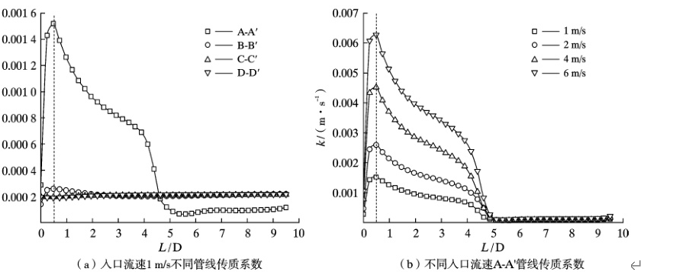
Figure 7 shows the mass transfer coefficients of different pipelines for T-type three-way confluence fittings. As shown in Figure 7, the mass transfer coefficient of the T-type three-way confluence fitting is the maximum at C-C^’, which corresponds to the downstream side wall of the main pipeline fork. In the downstream of the main pipeline fork along the flow direction, the side wall mass transfer coefficient increases first and then decreases; and the maximum mass transfer coefficient of the downstream side wall of the main pipeline fork at different inlet flow rates is located at 1D, indicating that the inlet flow rate has a great influence on the mass transfer intensive area.
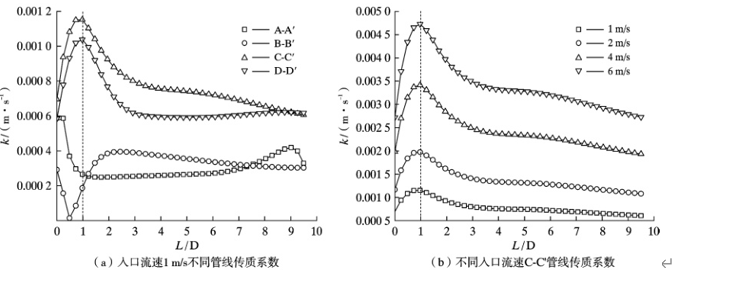
Fig. 6 Mass transfer coefficients of T-shaped branching pipe
The domain position has no effect. Comparing the mass transfer coefficient of the T-shaped three-way pipe splitting fittings in Figure 6b, it is found that the maximum mass transfer coefficient of the splitting fittings is slightly greater than the maximum mass transfer coefficient of the merging fittings in Figure 7b at the same flow rate.
Figure 8 shows the flow accelerated corrosion rate of different pipelines of the T-shaped three-way splitting fittings. It can be seen from Figure 8 that, similar to the mass transfer coefficient of the T-shaped three-way splitting fittings, the most sensitive area of the splitting pipe flow accelerated corrosion is located at the auxiliary outlet of the branch pipe
Fig. 7 Mass transfer coefficients of T-shaped merging pipe
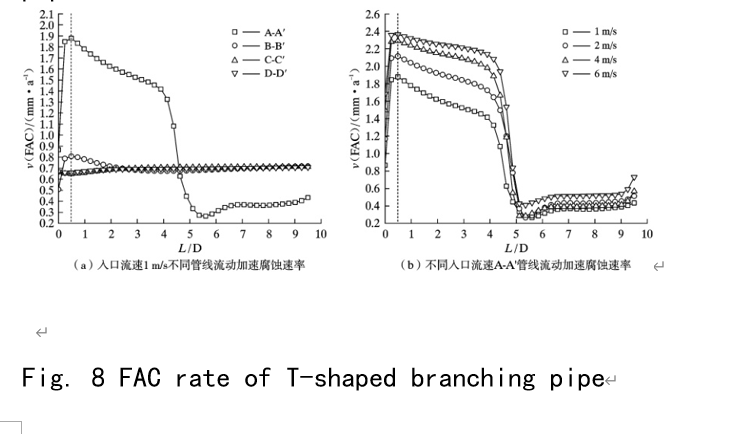
0.5D flow-facing surface position. The flow-accelerated corrosion rate is calculated by formula (3). With the increase of inlet flow velocity, the maximum flow-accelerated corrosion rates are 1.878, 2.115, 2.291, and 2.365 mm/a, respectively; and the change of inlet flow velocity has no effect on the flow-accelerated corrosion sensitive position (0.5D) and the minimum flow-accelerated corrosion rate position (5.4D).
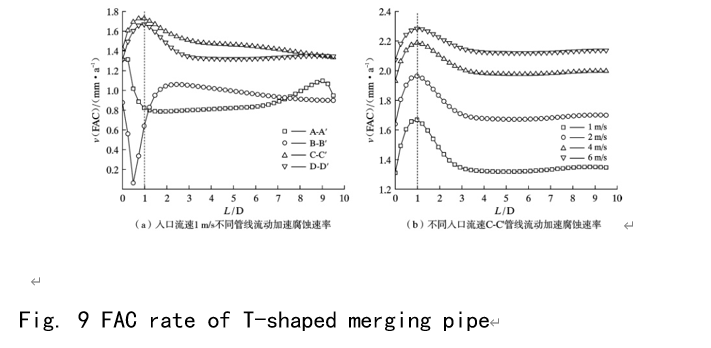
Figure 9 shows the flow-accelerated corrosion rates of different pipelines of T-type three-way confluence fittings. As shown in Figure 9, the T-type three-way confluence fittings present the most sensitive area for flow-accelerated corrosion on the downstream side wall (C-C’) of the main pipeline fork.
With the increase of inlet flow velocity, the flow-accelerated corrosion rates of the downstream side wall of the main pipeline fork are 1.668, 1.964, 2.187, and 2.284 mm/a, respectively, all located on the 1D side wall downstream of the main pipeline fork. Compared with the T-type three-way splitter pipe in Figure 8, the T-type three-way splitter pipe is more likely to fail at the same inlet flow rate. The simulation results are consistent with the actual statistical results of the power plant site [4.15.16] and the results of the literature test [5], indicating that the simulation results can provide a reference for predicting the FAC position and velocity size of the three-way pipe fittings in the power plant.
4 Conclusions
(1) The flow-accelerated corrosion sensitive area of the T-type three-way splitter fitting is located at the 0.5D flow-facing surface of the branch pipe auxiliary outlet; the T-type three-way converging fitting is located at the 1D side wall downstream of the main pipe bifurcation.
(2) At the same inlet flow rate, the flow-accelerated corrosion of the T-type three-way splitter fitting is more serious than that of the T-type three-way converging fitting.
(3) The change of inlet flow rate has no obvious effect on the flow-accelerated corrosion sensitive position of the T-type three-way splitter fitting and the T-type three-way converging fitting.

